Original Dataset
Raw Data
The table below is the full dataset used for the charts on this page. It includes the main variables that help compare these schools beyond just name recognition.
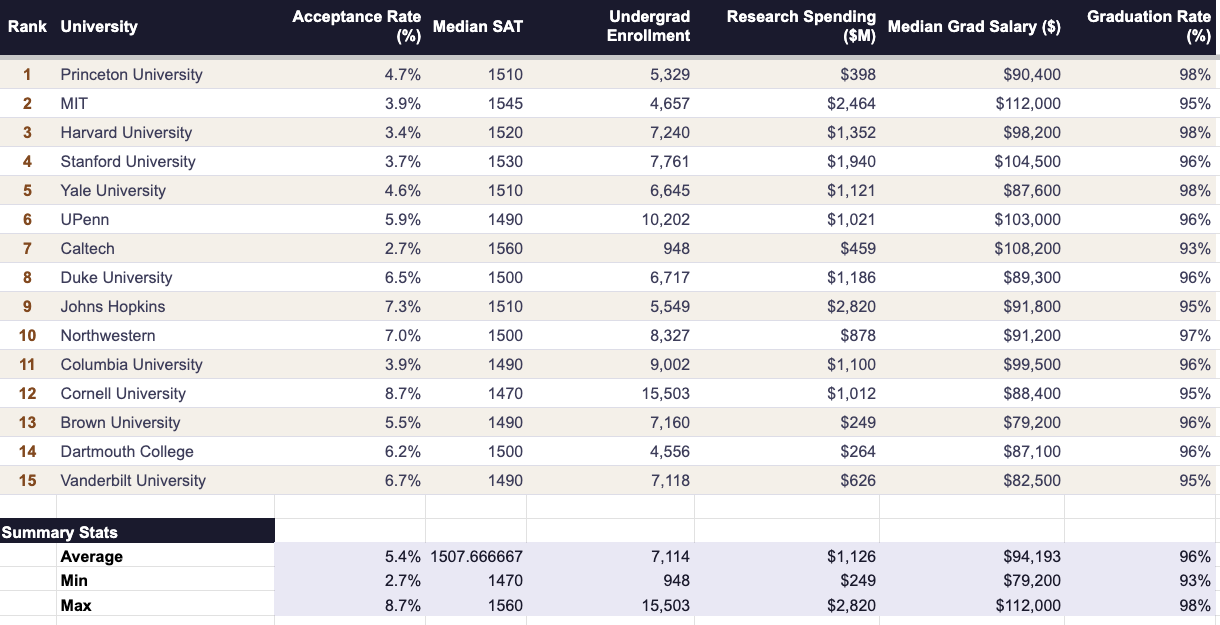
A closer look at selectivity, research spending, and student outcomes across 15 highly ranked schools.
This page looks at a group of top U.S. universities using a few simple measures: acceptance rate, median SAT, research spending, graduate salary, and graduation rate. Instead of just repeating school rankings, the goal here is to see what the numbers actually suggest about selectivity, investment, and student outcomes.
The table below is the full dataset used for the charts on this page. It includes the main variables that help compare these schools beyond just name recognition.
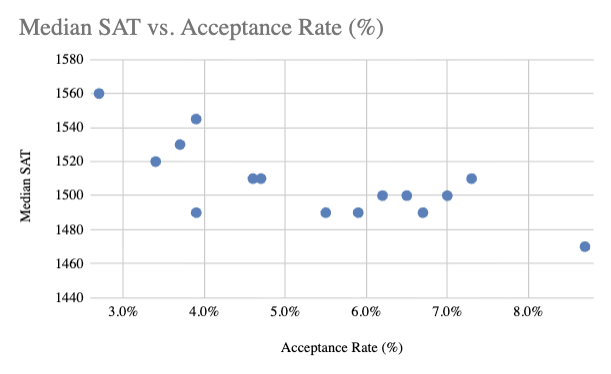
This chart shows a pretty clear pattern. Schools with the lowest acceptance rates usually also have the highest median SAT scores. That makes sense, since the most selective schools tend to attract and admit very strong applicants.
At the same time, the differences in SAT scores are not huge once you get into this top group. Even though acceptance rates vary quite a bit, most of these universities are still drawing from a very high-achieving applicant pool.
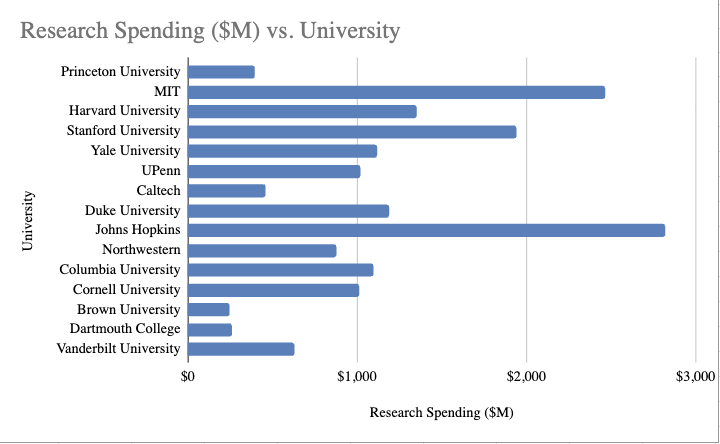
This chart stands out because the spending levels are not evenly spread at all. A few universities, especially Johns Hopkins, MIT, and Stanford, spend far more on research than the rest of the group.
That matters because it shows that schools can be similar in prestige while still being very different in where they put their money. Some universities clearly lean much more heavily into research than others.
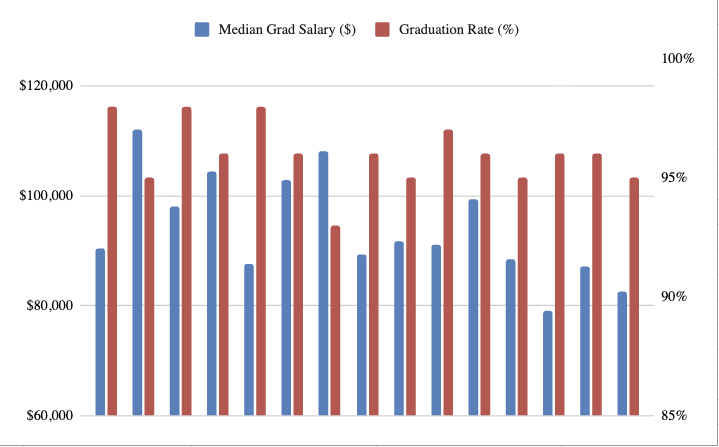
One thing this chart makes obvious is that graduation rates are high almost across the board. There is some variation, but not a dramatic amount. These schools are all doing a strong job of getting students to the finish line.
Graduate salary, though, shows more separation. Some schools are clustered much higher than others, which suggests that the value of a degree is not showing up equally in early-career earnings.
Looking at the charts together, the main point is that top universities may look similar on the surface, but they are not strong in exactly the same ways. Some stand out more for selectivity, some for research, and some for graduate outcomes.
That is why it makes more sense to look at the underlying numbers instead of relying only on rank. The data gives a more complete picture of what each school is actually offering.